


Triangle patterns are a frequently-utilized technique in technical analysis. Recognizing patterns is a key aspect of a trader’s ability to identify trends, predict future market outcomes, and ultimately trade with greater success and profitability. Triangle patterns are valuable because they provide insight into the continuation of bullish or bearish markets, and they can also signal a possible market reversal.
Triangle patterns is depicted by trendlines along a converging price range which suggests a pause in the initial trend of the market. Triangle patterns are categorized as continuation patterns. The three main types of triangle patterns are ascending, descending, and symmetrical.
Recognizing Triangle Patterns
The easiest way to distinguish the triangles is through the trend lines.
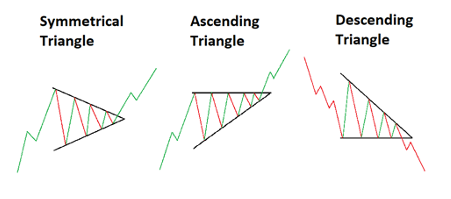
Familiarizing oneself with the three types of triangle chart patterns is crucial for traders. To help, we use line chart illustrations above to visually represent the patterns for traders to familiarize themselves with the three technical analysis charts. Most traders also prefer using candlestick charts, which are available in our MetaTrader 4/5 platforms.
Symmetrical Triangles enclose the price with an uptrend and downtrend line.
Ascending Triangles have an uptrend line into a Resistance line.
Descending Triangles have a downtrend line into a Support line.
Understanding Triangle Patterns
- The ascending triangle and descending triangles
The ascending triangle is considered a bullish indicator (bearish for descending) as it forms an uptrend (downtrend for descending). An ascending triangle is where you see a series of higher lows that form into a flat resistance level. A minimum of two swing highs and swing lows are sought to validate a triangle formation.
The works behind the triangle pattern are as follows:
Price reaches a resistance level and traders begin shorting the market pushing price back down. This scenario repeats multiple times, with each time the bearish pullback becoming weaker. As the market forms lower highs into the resistance, traders stop shorting the market conceding to the bullish move breaking the resistance. Simultaneously as the resistance is broken, a cluster of stop losses set by the prior short trades get triggered. This becomes a burst of buy orders with the addition of momentum traders piling into the trade, the market breaks up higher.
Descending triangle, as mentioned is simply the inverse of the ascending triangle.
In simple terms, ascending triangles signal a bullish trend and predict a move to the upside, while descending triangles signal a bearish trend and predict a move to the downside.
- The Symmetrical triangle
The Symmetrical triangle has no bearish or bullish bias, it only signals that a breakout is likely to occur. These are more commonly found in the period of consolidation as it signals indecision within the market. Due to its nature of non-biasness, when having spotted a symmetrical triangle formation, it is important to take note of the succeeding price action and the behavior of other indicators to determine its breakout direction.
Symmetrical triangles, are characterized by price action that becomes progressively narrower and may be followed by a breakout in either an upward or downward direction.
Trading the Descending Triangle Pattern as An Example
01. You recognize two swing highs and two swing lows into a support level. A descending triangle criteria.
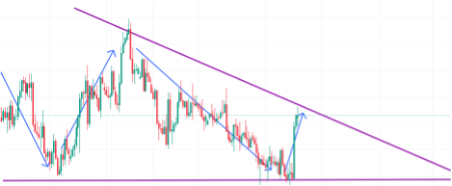
02. You know that a descending triangle will most likely breakout towards the bottom. So do you short the moment you spot the pattern formation?
It is possible; however, it would be very risky as a strong bullish movement could invalidate the pattern. Thus, the best course of action would be to wait for the initial breakout to occur.
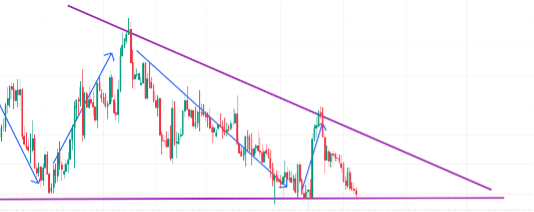
03. Price, as expected, the bears have pushed the price back down into the resistance.
Do we go short now? Again, it is possible. We could open a short position as we see bearish strength. However, resistance might reject the breakout a third time, which causes the price to push back once again. Depending on where you setup your stop loss you might incur an early loss. We need stronger confirmation.
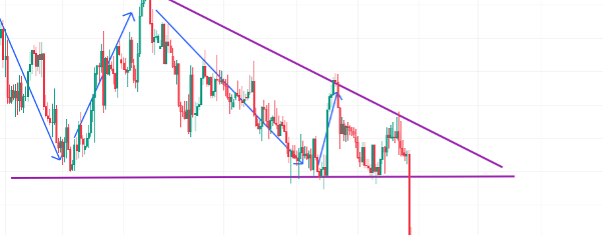
04. It seems that after a third rejection, followed by a lower high, the market has broken past the resistance level.
05. The position should be taken once the breakout candle has closed. We do not want to open a position whilst the breakout is occurring as the price is still live and can simply form a large lower wick.
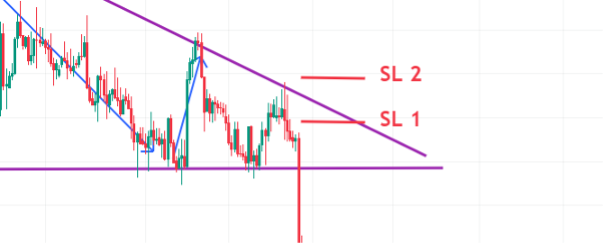
06. There are multiple ways to set a stop loss (SL) when trading chart patterns.
The two most common ways are:
SL1: Setting the stop loss in the middle, between the resistance line and downtrend line with a buffer. If the price was to hit this stop loss it would invalidate the breakout, possibly signalling a fake-out.
SL2: Setting the stop loss beyond the downtrend line/previous swing high with a buffer. This is a much safer way to ensure that, if a fake-out was to occur before continuing the bearish trend, your stop loss would be less likely to get taken out.
Other standard methods of setting a stop loss would be using other indicators such as ATR, SR levels, Moving averages etc. These methods are also viable and are used by many traders when trading chart patterns.
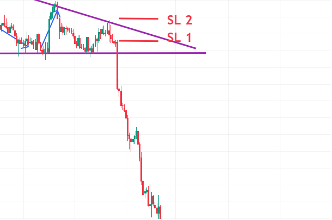
07. Fortunately, the market did not fake-out, and we were able to catch a massive breakout move from the triangle pattern.
Also remember, chart patterns are not a guarantee of future performance
It is important to keep in mind that chart patterns are just indications of where the price of an asset may be headed in the future. When using chart patterns, it is advisable to wait until the direction of the move has been established before entering a trade.
In certain situations, it can be a sound tactic to place orders above and below the support/resistance/trend line when a breakout seems imminent. This way, when either order is activated, you can cancel the other, aiming to capture the breakout in whichever direction it occurs. Nonetheless, this approach is still susceptible to false breakouts. To validate that the break is genuine and not a trick, traders should keep an eye out for a surge in volume and wait for at least two closes beyond the trend line.
When dealing with symmetrical triangles, it is typical for the price to continue in the same direction as the initial move before the triangle formed. For instance, if the price was in an upward trend before the triangle appeared, traders would anticipate the price to break out and continue upward. To minimize risk, it’s crucial to set stop orders. Waiting for one or two candle formations after the breakout to confirm their validity is a recommended approach. Experts tend to observe the closing price on the first candle formation to determine whether it is higher than the trendline in a bullish pattern or lower than the trendline in a bearish pattern.
Triangle patterns are easy to identify and can become a great tool for trading breakouts. However, like all tools they are not ironclad, confirmation in conjunction with other indicators will largely benefit your analysis and increase your chances of correctly predicting the market. To minimize the risk of a false breakout and maximize profits, it’s important to follow good risk management practices and maintain a favorable risk-to-reward ratio in all trades. It is important for traders to use chart patterns as one tool in a larger trading strategy, along with other forms of technical and fundamental analysis.

ZERO Markets is a trusted broker offering CFD trading in the global market. ZERO Markets is fully regulated and licensed for your comfort and security. We offer the best trading environment with reduced spreads from 0.0 pip, latest technology platforms and instant deposit channels.
Leave a Reply