


Volatility is the measure of the fluctuation in trading prices. How large the upswings and downswings are for a currency pair can become useful information when on the lookout for trading opportunities.
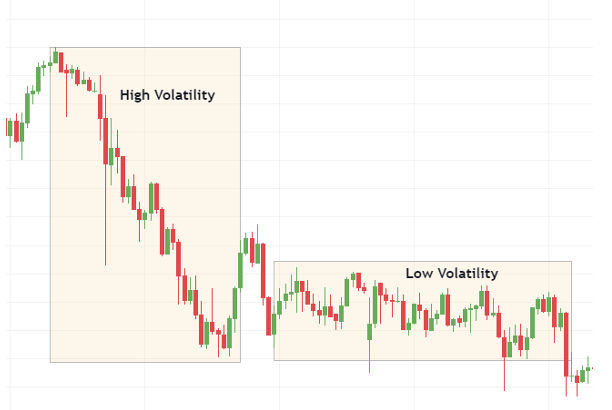
Volatility indicators basically tell us whether the market is noisy with big swings or quiet and not moving much.
There are multiple volatility indicators out there, but we will focus on one specific indicator – Bollinger Bands, to give a basic insight in this blog.
Bollinger Bands
Bollinger Bands is an indicator that is overlayed on the chart and comes with three sections or bands, the upper band, middle band, and lower band, inside which the middle band is a 20 SMA (Simple Moving Average).
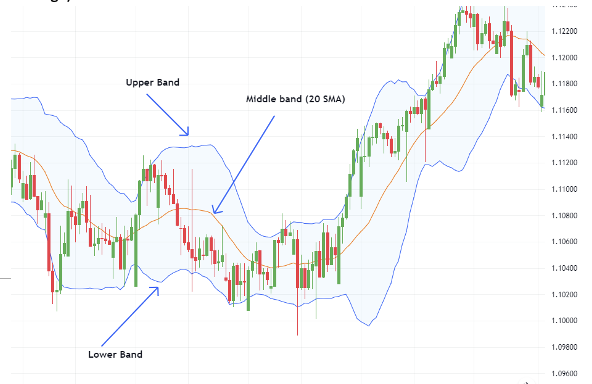
The upper band is 2 standard deviations (std dev) away from the middle band and the lower band is 2 standard deviations away from the middle band.
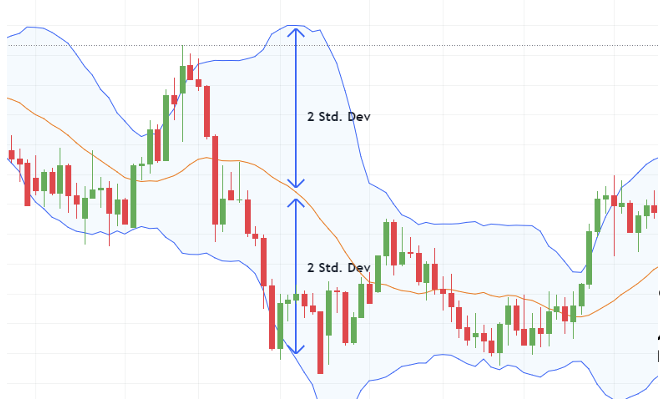
Now, the period of the SMA and the std dev can be altered however most traders would recommend sticking with the default settings when using the Bollinger band indicator.
This is due to the way that STATISTICS works. 2 std dev, front and back, from the center (the 20SMA) represents 95% of all data that has occurred. In our case, if the upper and lower bands are 2 std dev then 95% of price moves that have occurred are contained within the bands.
As the Bollinger bands contain 95% of price movements, it is helpful in identifying:
- Overbought areas
- Oversold areas
- The volatility of the market
These are the most widely used and effective Bollinger band settings, but traders can alter them based on their personal strategies and market conditions.
Overbought vs Oversold
Just a quick briefing of the terms overbought and oversold as it will come up a lot with other indicators.
Overbought describes a market where its trading higher than its intrinsic value. This makes that overbought market a good sell target.
Oversold describes a market that is trading lower than its intrinsic value. This makes that market a good buy target.
In layman’s terms, price has either reached too high or too low and is now vulnerable to the opposing force. Just a note to remember that just because its overbought/oversold does not mean that it will reverse. In a trending market you will notice that price is always overbought/oversold.
Now back to Bollinger bands.
If the price is near the upper Bollinger band it is considered overbought, conversely if it’s near the lower Bollinger band it is considered oversold. So, should you not just short when its overbought and go long when oversold? Well, as we just discussed price can stay overbought/oversold for a long time when the market is in a trend. Then what should we do? Do we ditch the Bollinger band indicator?
Well not exactly, remember a market can be overbought/oversold for a long time during a TREND. Thus, we just need to take advantage of the indicator during a ranging period.
The Bollinger Bounce Strategy
There aren’t many trading strategies that come with trading in a ranging market. When the price is near the upper band(resistance) you would short, when the price is near the lower band(support) you would long. Then, what is the difference between using the Bollinger band vs setting up your own support and resistance (SR) levels?
The greatest advantage Bollinger bands have is that it is unbiased. The Bollinger bands are calculated using the 20SMA and 2 standard deviations, giving a neutral answer. The SR levels constructed by hand are dependent on the traders’ bias, whether they believe the level is significant or not.
Another advantage the Bollinger band has is that it is a dynamic boundary. As the calculation is based on the simple moving average, the upper/lower bands act as dynamic SR levels.
An example of a Bollinger Bounce setup would look like this:
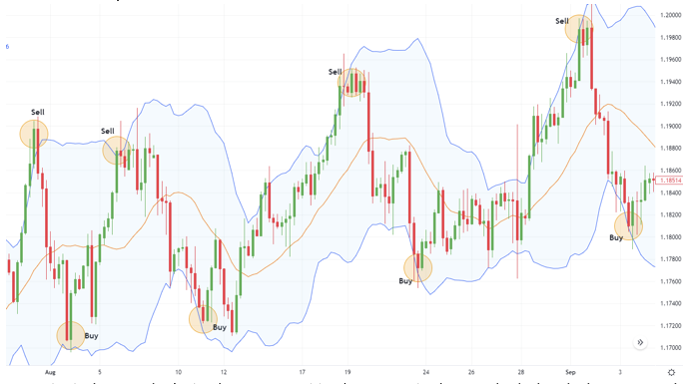
You see that the EUR/USD is in a range. Setup the Bollinger Band indicator and wait for the price to move to the upper band. Price has hit the upper band and looks to reverse. You open a short position setting your stop loss just above the upper band and the take profit either at the middle or lower band. Vice versa if the price was to move to the lower band.
Vice versa if the price was to move to the lower band.
The key point is that you don’t simply enter a position because the price has touched a band. The moment the price makes contact with a band, it’s signaling an opportunity for a potential trade. The decision for entry should be made using other price-reading tools.
Bollinger band in a trending market may not be the sharpest tool. However, given the right market conditions they are still able to provide some decent setups. In a trending market, let’s assume bearish, the price will be near the lower band most of the time. You need to be on the lookout for, when the price retraces back to the 20SMA or even further to the upper band, as that could be an opportunity to open a position in direction of the trend.
There does exist the risk of it not being a retracement and instead a total trend reversal, so it is advised to be cautious when trading in a trend using a Bollinger band strategy.
The primary drawback of using the Bollinger band indicator is that it requires adjusting the band settings to suit the market being invested in. Technical analysis is a blend of art and science, as it involves analysing the behaviour of an asset and determining if the widely-used settings are effective. If not, traders may need to adjust the length of the simple moving average to better align with the market’s specific needs.
In this article, we have thoroughly explored the attributes of Bollinger Bands, including the most commonly used settings and trading techniques. With this knowledge, you have greater opportunities to develop effective trading strategies and generate profits. In conclusion, it’s important to conduct thorough research before utilizing an indicator in your trading strategy. This includes understanding the proper settings and determining if it aligns with your trading goals and if you’re capable of adjusting the settings if necessary.

ZERO Markets is a trusted broker offering CFD trading in the global market. ZERO Markets is fully regulated and licensed for your comfort and security. We offer the best trading environment with reduced spreads from 0.0 pip, latest technology platforms and instant deposit channels.
Trade Responsibly: This e-mail may contain general advice which does not take into account your individual circumstances or objectives. CFD derivative products are highly leveraged, carry a high level of risk and are not suitable for all investors. Features of our products including fees and charges are outlined in the relevant legal documents available on our website. The legal documents should be considered before entering into transactions with us. ZERO Markets does not accept applications from residents of countries or jurisdictions where such distribution or use would be contrary to local laws or regulations. Clients receiving services in Saint Vincent and the Grenadines: Zero Markets LLC, which is a registered company of St. Vincent and the Grenadines, Limited Liability Number 503 LLC 2020 uses the Domain www.zeromarkets.com. Please refer to our SVG Privacy Policy. If you are not the intended recipient of this email please do not print, copy or distribute its content or attachments.
Leave a Reply