


You may have heard that professional traders frequently discuss the significance of Fibonacci numbers and how they inform buying or selling decisions. But how does the role of these ubiquitous levels, rooted in straightforward mathematics, play in the market’s movements?
The Fibonacci sequence is a significant set of numbers and ratios that occur in various aspects of life. When employed in trading, traders can seek out countertrend pullbacks in corresponding ratios. Nevertheless, this mathematical tool offers a broad range of applications that can reveal potent trading prospects across the financial markets. By leveraging the insights derived from the Fibonacci sequence, traders can gain a deeper comprehension of market dynamics.
Fibonacci’s golden ratio in trading
Born in 1170 AD, Leonardo Fibonacci was a mathematician who developed both the Fibonacci sequence and the golden ratio. The Fibonacci sequence is a sequence of numbers where the subsequent number is the sum of the previous two numbers. As an illustration, the sequence starts with 1, 1, and continues with 2, 3, 5, 8, 13, 21, 34, and so forth.
The primary emphasis lies on the relationship between the numbers in the Fibonacci sequence, which is regarded as the fundamental aspect of Fibonacci’s work. As we progress down the sequence, dividing any number in the series by the preceding number results in 1.618, known as the ‘golden ratio’.
Traders commonly utilize Fibonacci retracements in technical analysis to anticipate potential levels of price support and resistance in the markets. Suppose a market has experienced an upward trend but begins to retrace, as all markets do, rather than moving in a linear fashion. Traders will utilize Fibonacci ratios to estimate the level at which the retracement might halt and the market could resume its prior upward trajectory.
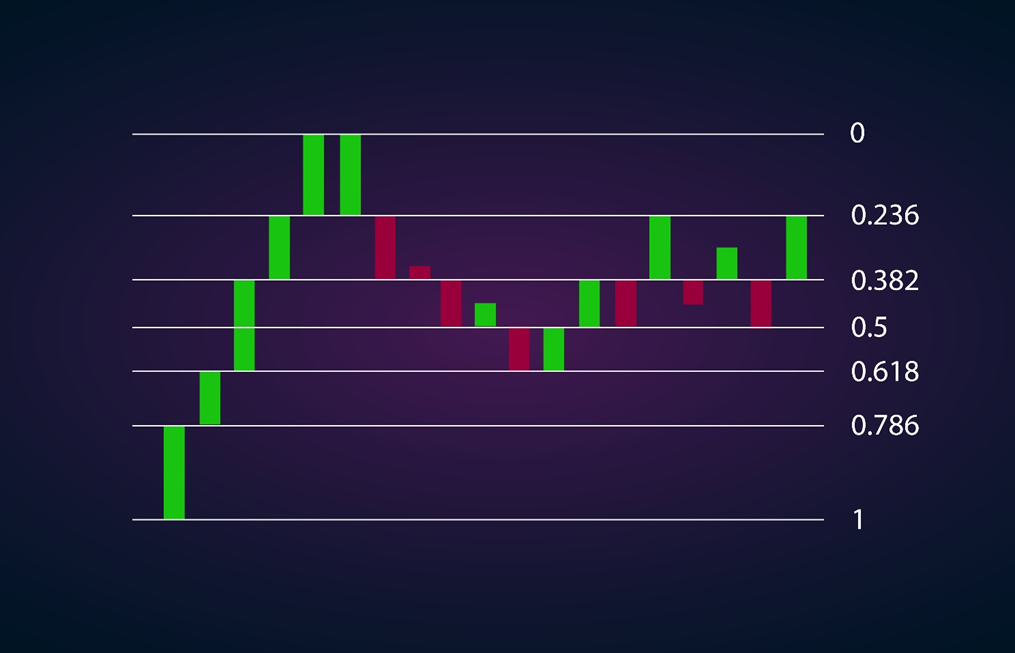
The golden ratio of 1.618 – that magic number – gets translated into three percentages: 23.6% (0.236), 38.2% (0.382) and 61.8% (0.618) in price charts.
An example of the Fibonacci pattern
There are five major Fibonacci retracement levels as causes Traders to pay attention 0.236, 0.382, 0.5, 0.618 and 0.6786 in a 0-1 range. You can use the Fibonacci retracement tool in MetaTraer 4/5 platform to draw on any price chart.
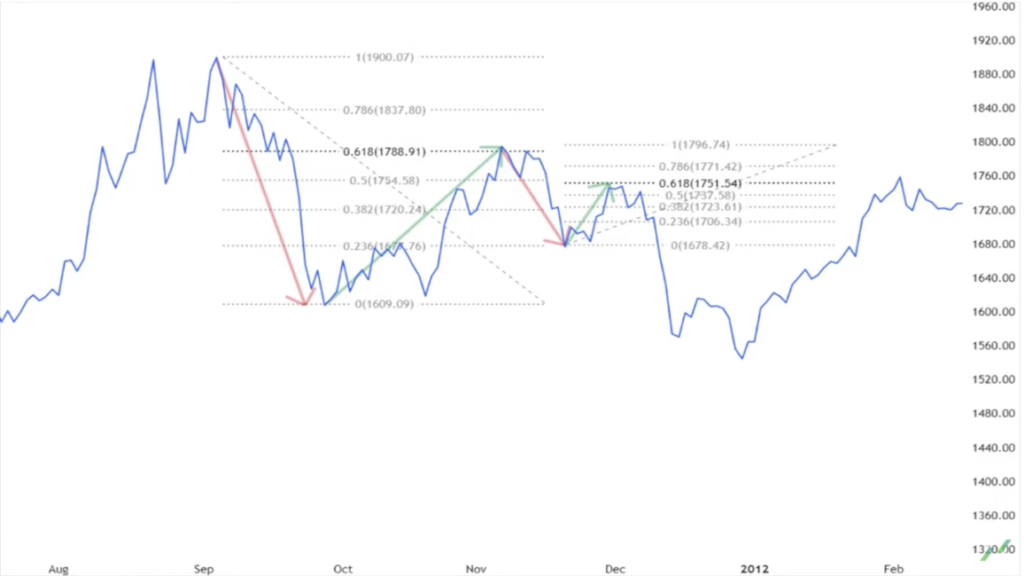
The example shows the price of gold when it started from September in 2011 twice in a row it fell then back to the 0.618 level before dropping again. The market rebounds and moves out to fresh highs for the recovery.
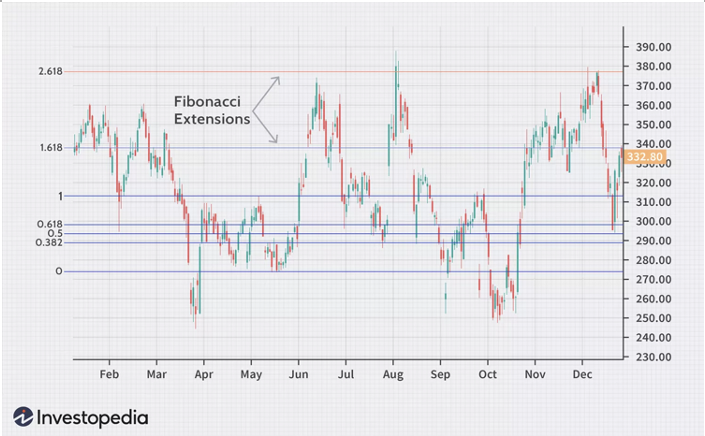
Fibonacci Extensions vs Fibonacci Retracements
Fibonacci retracements and extensions serve different purposes in technical analysis. Retracements provide insight into how deep a trend’s pullbacks may be, while extensions indicate where the price may go after a retracement. Essentially, retracements gauge the extent of price pullbacks within a trend, while extensions measure the impulse waves in the direction of the trend.
- Fibonacci Expansion/Extension
The Fibonacci extension or expansion tool is commonly used by traders, as common as moving averages, in establishing potential price targets. Fibonacci levels establish areas of potential resistance/support; thus, extensions have no real value in a ranging market as there are only one potential support and resistance, the market has no prospect of making any higher highs or lower lows.
You set the Fibonacci Extension by finding two points, a swing high and a swing low. If it’s a downtrend market, you go from high to low and vice versa for an uptrend market. Now, we select the third point, the end of the retracement that’s against the market. The extensions will then calculate the potential price levels the market will move to. These levels are based on Fibonacci ratios and the common levels (as percentages) are 61.8%, 100%, 161.8%, 200% and so on.
So, one may set up a take profit at the 61.8% or the 100% extension.
- Fibonacci Retracement
The Fibonacci extension level, as discussed, shows the potential profit targets we can take. However, to construct it, we must first know the initial retracement. For that we have the extensions counterpart, the Fibonacci Retracement.
The Fibonacci Retracement tool is much like the extension tool but in reverse, it instead will provide you with possible levels where the price will retrace to, giving you the ideal point for setting up the extension tool and potential position entry.
Tips for Drawing The Fibonacci Retracements
Drawing and constructing the Fibonacci retracement is quite like the extension tool, just without the last step. Two points for setup, a swing and a swing low is all that is needed. Uptrend, swing low to high, downtrend swing high to low, you see the pattern.
Once plotted, the Fib retracement is drawn it shows four common retracements (again in percentages): 23.6%, 38.2%, 50% and 61.8%.
All four levels are common retracements however they are weighted differently. Overall, the 23.6% retracement is considered relatively shallow, they might raise a flag or two but shouldn’t be taken too seriously. When the price reaches the 38.2 – 50% range the retracement can be considered moderate, you will see some action and could potentially look for an opening. Even deeper, the 61.8% retracement is also known as the golden retracement.
Once the price hits these retracements, you can start looking for potential entry points. However, it is not wise to immediately take an entry simply because the level has been struck. Trends can always reverse, and prices can always fake-out. After your own method of confirmation, that price is back on the trend, you should confidently open a position.
FAQ
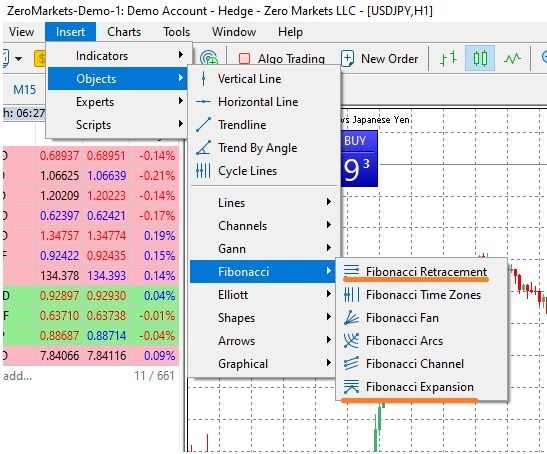
Does MetaTrader 4/5 offer to draw Fibonacci Expansion and Fibonacci retracements?
Yes, in MetaTrader 4 both functions are available through: Insert -> Fibonacci -> Retracement or Expansion
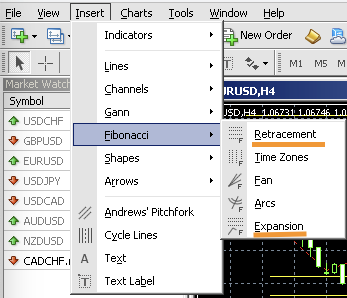
In MetaTrader 5 both functions are available through: Insert -> Objects -> Fibonacci -> Retracement or Expansion

ZERO Markets is a trusted broker offering CFD trading in the global market. ZERO Markets is fully regulated and licensed for your comfort and security. We offer the best trading environment with reduced spreads from 0.0 pip, latest technology platforms and instant deposit channels.
Leave a Reply