


MACD Definition
The MACD, also known as Moving Average Convergence Divergence, is a momentum indicator that signals the strength of the momentum for the underlying financial assets including Forex (foreign exchange trading), shares, commodities, indices and cryptocurrencies. Furthermore, it utilizes moving average crossovers to signal trend changes.
The MACD value is calculated by the difference between two exponential moving averages, with more weight placed on recent price action in order to determine momentum changes via exponential smoothing.
To apply the MACD indicator on MetaTrader 4 and MetaTrader 5, select Insert>Indicators>Oscillators>MACD. The MACD’s histogram is displayed as the outline of the signal line.
Calculations behind MACD
By default, the two EMAs contributing to the MACD indicator are 12 and 26 periods, operating as a short-term and long-term indicator. The signal line is a 9-period EMA of the MACD value and the histogram measures the difference between the signal line and MACD.
MACD value: 26-period EMA – 12-period EMA
Signal line: 9-period EMA derived from the MACD value
MACD histogram: MACD value – Signal line
Despite the default inputs, traders are free to change and modify the inputs to suit their trading strategy.
MACD Strategies
For momentum traders, common MACD strategies including centreline crossovers, signal line crossovers, and divergences are used to provide good trading signals.
Centreline Crossover
The first common approach is the zero-centreline crossover, consisting of bullish and bearish centreline crosses.
- A BULLISH centreline cross is identified when the MACD value crosses ABOVE the zero centreline, as the shorter-dated EMA crossing above the longer-dated EMA. This implies price pressure to the upside with momentum building.
- A BEARISH centreline cross is identified when the MACD value crosses BELOW the zero centreline, as the shorter-dated EMA crosses below the longer-dated EMA. This implies downward price pressure with momentum fading.
MACD may be lagging behind the actual price movement in nature, it still provides reasonable entry points as demonstrated below in figure 1.
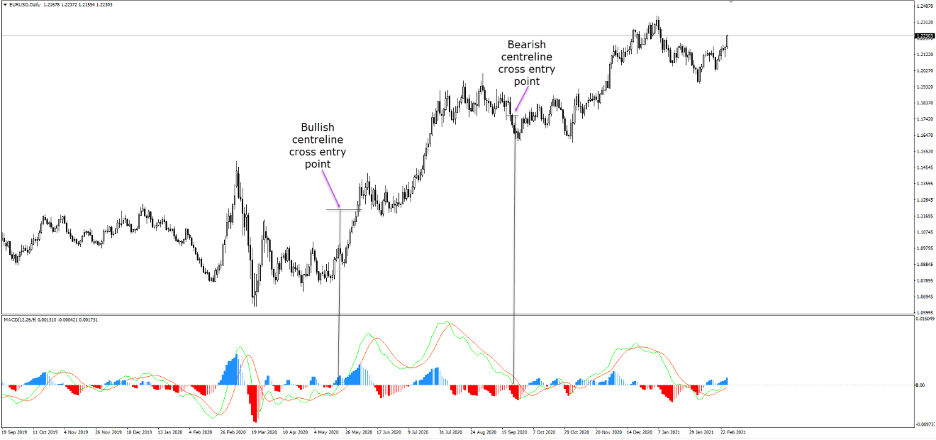
Source: MetaTrader 4
Signal Line Crossovers
Another popular technique is known as the signal line crossovers. The signal line which is a 9-period EMA of the MACD value (moving average of the MACD), is slower moving than the MACD value.
Similar to a traditional moving average crossover strategy, a buy signal is formed when the MACD value (faster moving average) crosses above the signal line (a slower moving average). On the other hand, when the MACD value crosses below the signal line, it would be seen as a sell signal.
The crossovers are seen as a turning point with momentum is reversed and accelerated in the direction of the crossover.
An example of bullish and bearish crossovers can be seen in Figure 2 below.
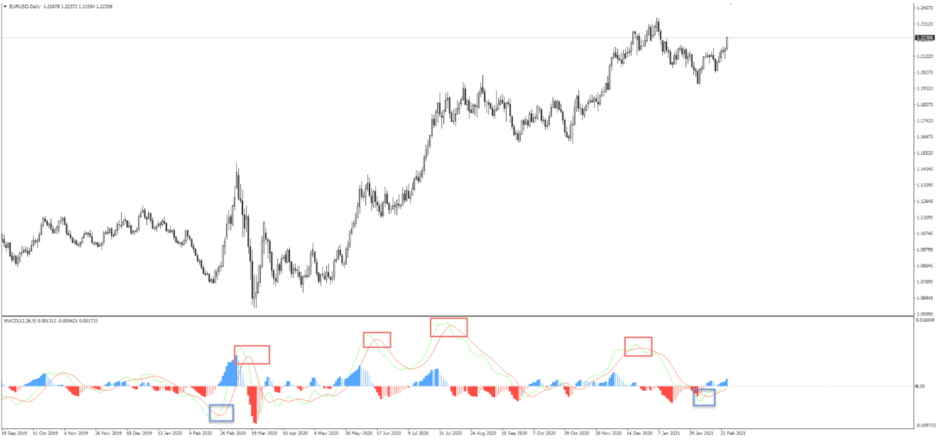
Source: MetaTrader 4
Read More on:
Overbought and Oversold Signals
Unlike the Relative Strength Index, which provides clear overbought and oversold signals, MACD doesn’t have a bounded surface to provide such clear indications. However, some traders opt to apply limits based on historical highs and lows. Figure 3 shows historical movement serving as good indicators for upper and lower boundaries and therefore, overbought and oversold areas.
Some traders will interpreter bullish/bearish signal line crossovers formations near these overbought and oversold areas as a stronger trend change.
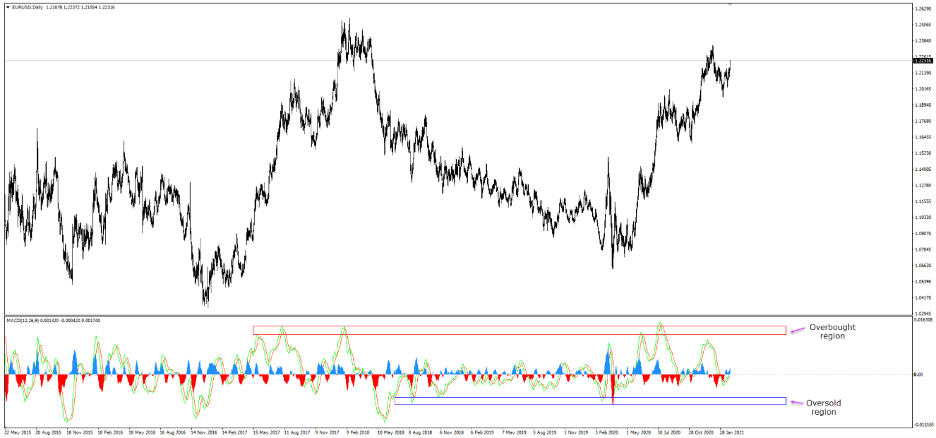
Source: MetaTrader 4
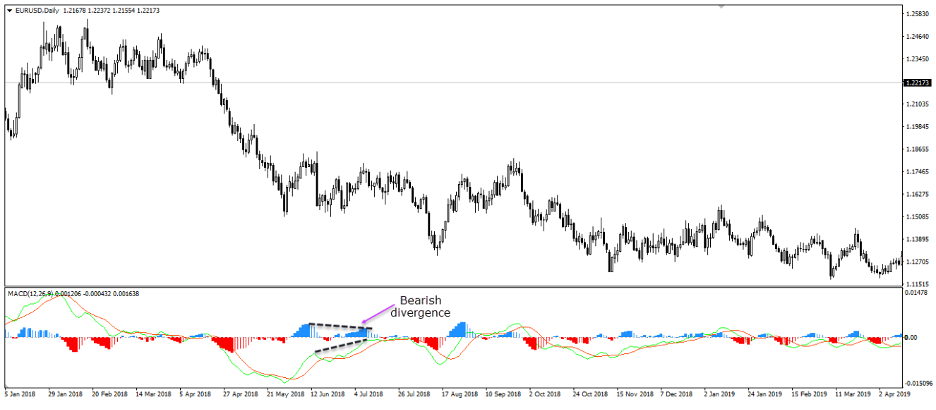
Divergence
Divergence refers to the diverges between the MACD and the price movement. A bullish divergence takes shape when the price falls to a lower low but the MACD value shows a higher low. Figure 4 shows a bullish divergence where the lower low in price action confirms a downward trend, yet the MACD’s higher low implies that the momentum to the downside is fading.
Figure 5 also shows a bearish divergence where the price action recorded a higher high but the MACD value showed a lower high, indicating the fade of upward momentum.
Divergence is considered a leading indicator as it does a good job at predicting trend reversals, sizeable retracement or pullbacks.
However, divergence does not guarantee the price action will react. It still has the probability of seeing the price continue trending despite the slowing momentum. For instance, in a bullish divergence, the price could continue to outpace the downside momentum if the MACD value remains above the zero centreline.
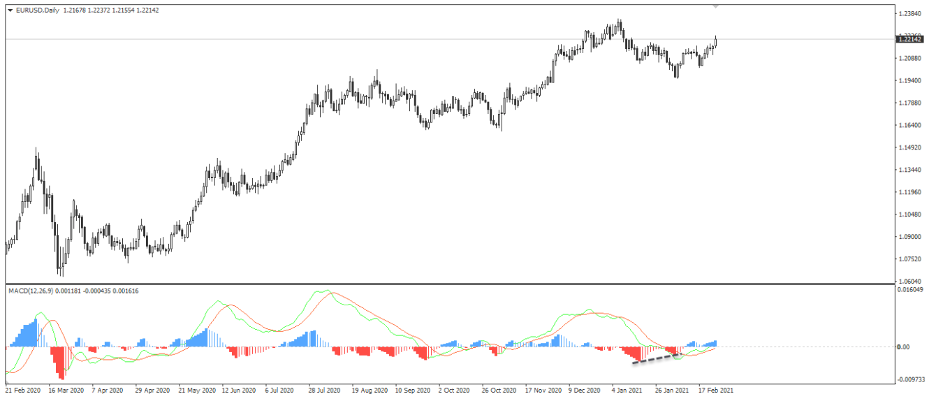
Source: MetaTrader 4
Source: MetaTrader 4
Zero Markets provide a variety of account types suitable for all types of traders including ECN Account (Super Zero Account), Standard Account, Islamic Account, PAM/MAM, and Pro Trader Account. Start trading with the best-regulated CFD broker – Zero Markets. Enjoy competitive pricing and tight spreads starting from 0.0 pips across more than 60 tradable instruments.
Leave a Reply